
Week of July 15, 2019 Market Analysis
By Jing Zhu | Crescent City Capital Market Analyst Intern
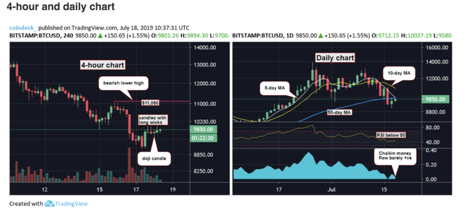
Wednesday, Bitcoin price dropped to $9,049 before coming back up to $9,850 today. The price is currently struggling to break resistance at $10,000. On the 4-hour chart, candles with long wicks indicate that Bitcoin’s recovery is slowing down. If price breaks below $9580 (the low of the doji candle made during Asian trading hours), then it would confirm a bearish lower high at $10,000, allowing for a potential drop to $9000. Technical indicators on the daily chart also show bearish signs. The RSI dipped below 50, indicating a bear market. The 5-day and 50-day MAs appear to be heading for a death cross. Furthermore, the Chaikin money flow index (measure of money flow volume) is barely positive, indicating declining strength of buying pressure.
Bitcoin Recovery May Not Last
Ripple vs. Ethereum Recovery
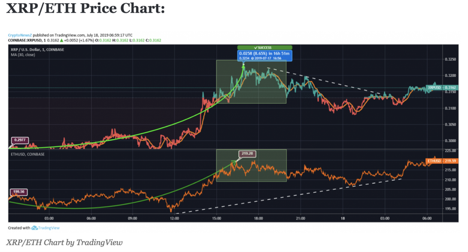
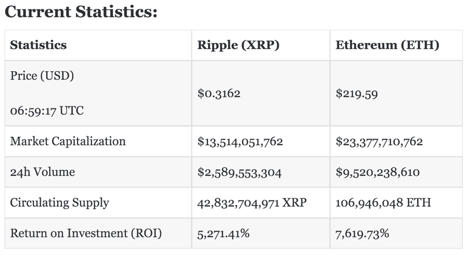
Right now, Ethereum is still below $230 but has increased from Wednesday’s price of $193.99. It is currently correcting above $215. Ripple is consolidating around $0.31, having risen above from yesterday’s price of $0.30 except for one swing below $0.308. In the last 24 hours, Ripple has increased 6.21%. Ripple may see resistance around $0.32- $0.33 with support near $0.28-$0.29. Ethereum’s resistance is near the $221-$231 range with support near $197-$183.
Litecoin Price Jumps 12%
At the beginning of this week, Litecoin dropped to levels below $80 before finding support at $76. On Wednesday, price recovered to $95. Yesterday, Litecoin is trading at $101, which represents about 12% gain in the market. It is likely that it will break $105. Overall, the current trend is bullish.
1. “Bitcoin Bounce Capped by $10K Price Resistance” by Okmar Godbole for Coindesk published 7/18/19
2. “Ripple vs. Ethereum: XRP and ETH Gearing Up for Much Awaited Price Recovery” by Ruti Vora for CryptoNewZ published 7/18/19
3. “Litecoin Market Overview: LTC/USD Jumps 12% Stepping Above $100” by John Isige for FXStreet published 7/18/19