Bitcoin Market Cap in 2017 v. 2019
By Jing Zhu | Crescent City Capital Market Analyst Intern
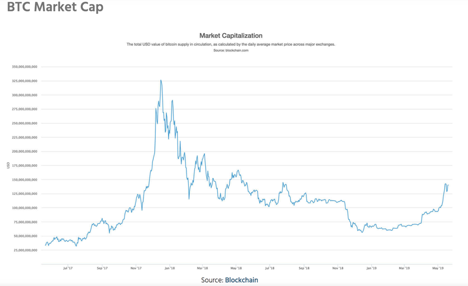
Currently, Bitcoin is experiencing another bull run. In May of 2019, prices surged well above $8000. This phenomenon has not been seen since November of 2017. For example, on November 25th, 2017, Bitcoin dominated the market across all cryptocurrencies, achieving a 52% overall market cap. Now in 2019, Bitcoin has achieved a 57% overall market cap.
Bitcoin Daily Transactions 2017 v. 2019
See diagram below:
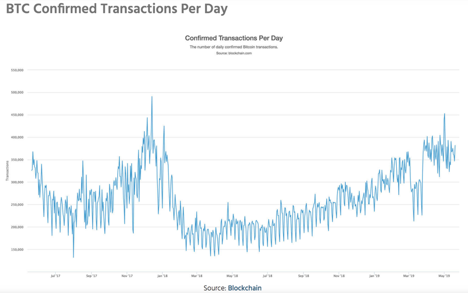
The number of daily transactions has increased by a small amount. In November of 2017, there were daily 337,000 transactions. Now, that number has increased to around 390,000 transactions. However, many analysts tend to agree that those numbers underrepresent the actual amount of economic activity occurring.
Bitcoin General Comparisons 2017 v. 2019
Overall, while Bitcoin has once again experienced a bull market, there are some differences from the one back in 2017. For example, the number of transactions, hash-rate, and average block size have all increased in 2019. Furthermore, there are more fiat-on ramps, which means that there are more exchanges that allow for fiat to crypto trading (like Binance). The SEC has reduced the number of scams since 2017, which protects users and their investments. Additionally, big-name companies like J.P. Morgan, Facebook, and Fidelity have increased Bitcoin adoptability in 2019. In general, the current bull run for Bitcoin seems promising.
- “Comparing Bitcoin Fundamentals at $8000 in 2017 vs. 2019, What Has Changed?” by Ali Martinez for Cryptoslate published 5/26/19
- “’2019 is the new 2017’ for Bitcoin, says Crypto ‘Wunderkind’” by Christina Comben for Bitcoinist published 6/10/19